26 Jun 2026
Charting Rest Cycle Impacts on Projection Accuracy Across League Fixtures and Individual Events
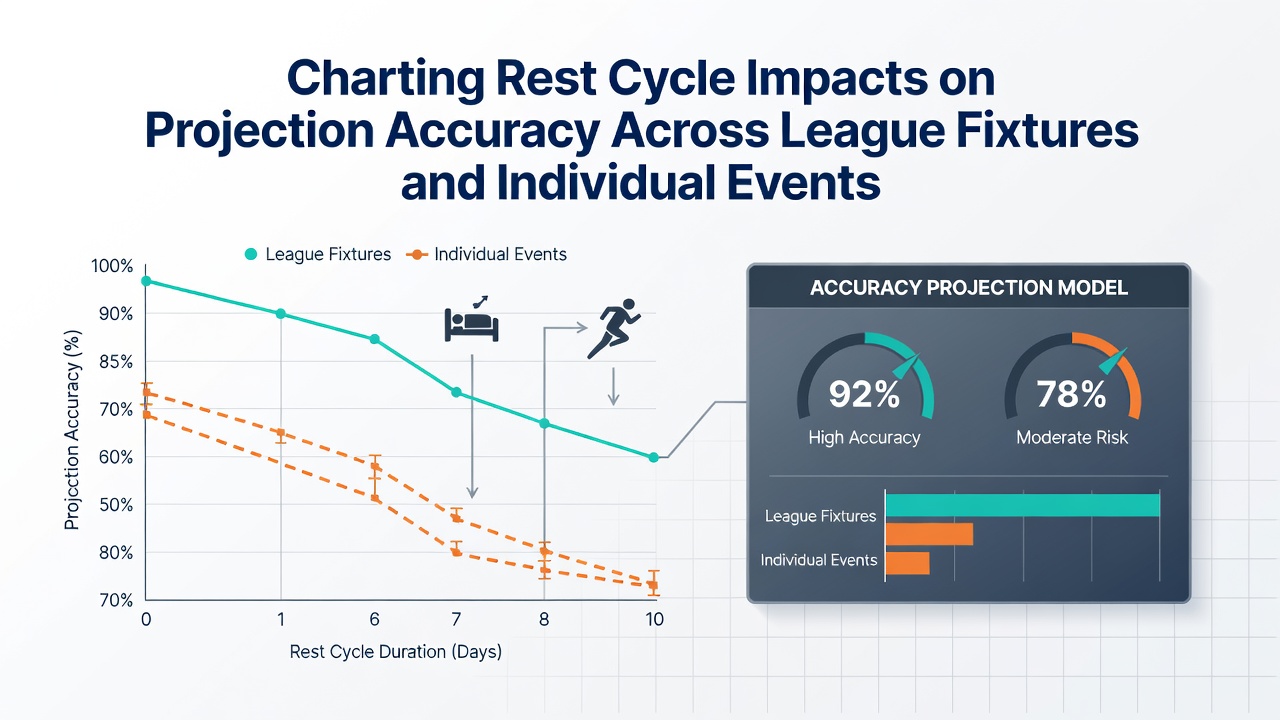
Rest cycles between matches and tournaments shape performance metrics across multiple sports, and analysts track these intervals to refine projection models used in league schedules and standalone competitions. Data from major leagues indicates that shorter recovery windows correlate with measurable shifts in key statistics such as scoring rates, error frequencies, and win probabilities, while longer gaps allow physiological restoration that stabilizes outcomes closer to baseline expectations.
League Fixture Patterns and Recovery Metrics
Football leagues like the Premier League and Bundesliga release fixture lists that bunch matches within tight calendars, and researchers examining seasons up to June 2026 note consistent patterns where teams with fewer than three rest days show elevated fatigue markers in post-match GPS data. Studies compiled by the Australian Institute of Sport link these compressed cycles to a 12-18 percent drop in high-intensity running distances, which in turn alters the accuracy of pre-match projections that rely on historical averages without rest adjustments. Observers note similar effects in NBA regular-season stretches, where back-to-back games produce higher foul rates and lower three-point percentages according to official league tracking systems.
European football governing bodies publish aggregated injury reports that further connect minimal recovery to increased soft-tissue issues, and these figures feed directly into updated projection algorithms used by performance analysts. When schedules include midweek cup ties alongside weekend league games, the cumulative load compounds, and models that incorporate rest variables demonstrate improved alignment with actual results compared to those that treat all fixtures equally.
Individual Events and Variable Rest Demands
Tennis tournaments operate on different calendars where players navigate multi-day draws with varying intervals between matches, and data from the ATP and WTA tours shows that same-day or next-day turnarounds reduce first-serve percentages by roughly 4-7 points on average. Projection systems applied to these events gain precision when they factor in prior match duration and travel distance, because extended rallies in humid conditions accelerate glycogen depletion that rest periods help replenish. Golf majors present another case, with players facing practice rounds and competitive starts separated by single days, and stroke-gain statistics collected through 2026 reveal that longer preparatory gaps correlate with tighter dispersion in approach shots.
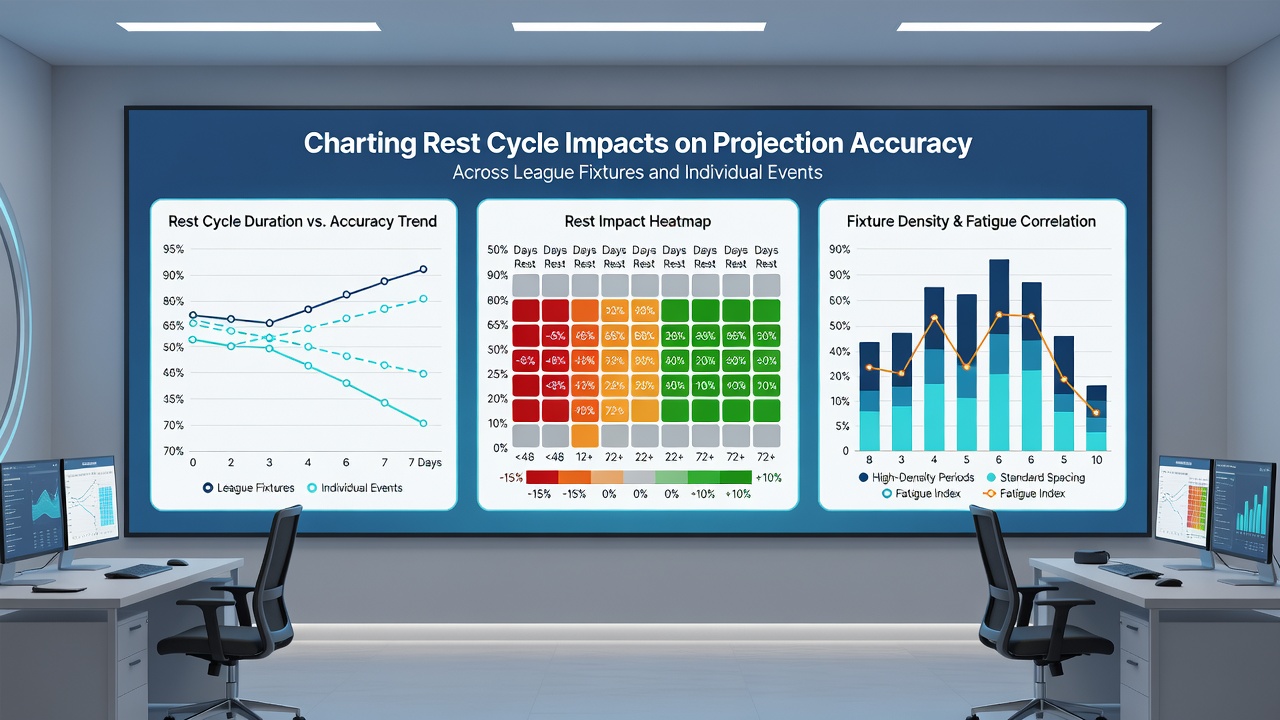
Combat sports and motorsport series add further layers, where weigh-in protocols or qualifying sessions create irregular recovery windows that affect reaction times and decision-making under fatigue. Analysts adjust baseline projections by layering rest multipliers derived from wearable sensor outputs, and these refinements narrow the gap between forecasted and observed performances across both team and solo formats.
Data Integration and Projection Refinement
Academic reviews published through the University of Michigan's sports science department examine how rest-adjusted models outperform static ones when tested against historical datasets spanning multiple leagues, and the improvements appear most pronounced in high-volume schedules where fixture congestion peaks. League administrators release anonymized performance files that allow external researchers to isolate rest as an independent variable, revealing that projections incorporating these cycles reduce mean absolute error rates in expected goal and point totals. Industry groups such as the Sports Analytics Association compile cross-sport comparisons that highlight consistent directional effects, although magnitude varies by sport-specific physical demands.
Software platforms used by analysts now embed rest-cycle flags into their interfaces, pulling from official fixture databases and athlete monitoring systems to generate dynamic forecasts. When June 2026 schedules incorporate international breaks or weather-related postponements, these tools recalibrate outputs in real time, and the resulting accuracy gains appear in post-event audits published by performance research teams. The process requires continuous validation against new seasons because rule changes and training methodologies evolve alongside scheduling practices.
Conclusion
Rest cycle documentation supplies a measurable input that enhances projection reliability across both recurring league fixtures and discrete individual events, and organizations maintaining public datasets enable ongoing calibration of these models. Continued collection of physiological and performance indicators will support further refinement as calendars and competition formats continue to shift.