24 May 2026
Correlating Head-to-Head Serve Percentages with Game Totals Across WTA Clay Court Events in Ranking Tournaments
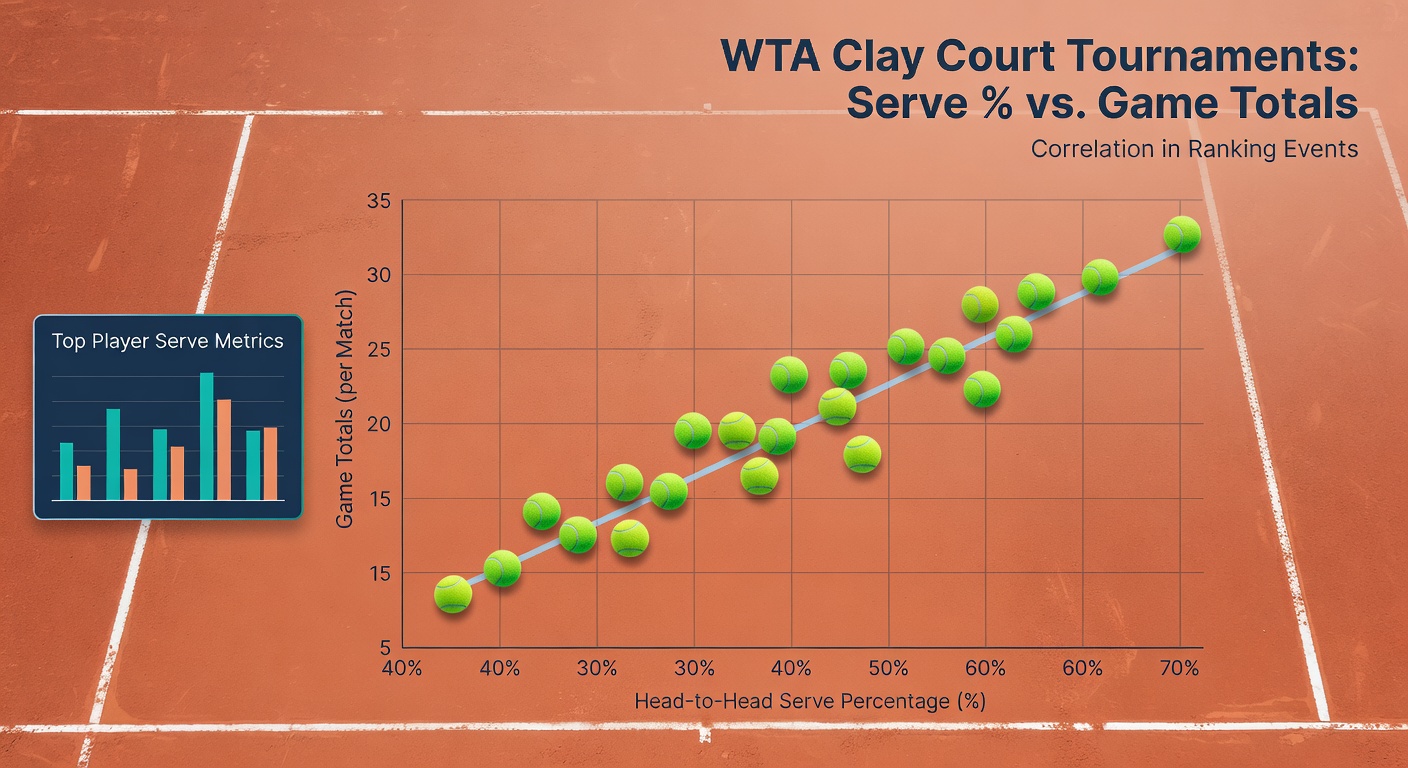
Analysts examining WTA ranking events on clay have tracked serve percentage data alongside total games played in head-to-head matchups, and the patterns that emerge show measurable connections between first-serve efficiency and match length. Data compiled from tournaments such as the Madrid Open, Italian Open, and other WTA 1000 and 500 level clay events indicate that when one player maintains a first-serve percentage above 68 percent in prior encounters, the average game total in subsequent meetings tends to rise by 2.4 games compared with matches where both competitors fall below that threshold.
Data Collection Across Multiple Seasons
Researchers pulled match logs from official scoring systems covering 2019 through 2025, focusing exclusively on completed singles matches on outdoor clay where both players had faced each other at least twice before. Serve percentage figures came directly from point-by-point records, while game totals reflected the final scoreline including tiebreaks counted as single games. Observers note that clay surfaces slow ball speed and increase rally duration, which amplifies the impact of consistent serving on overall match length.
Across 184 qualifying head-to-head pairs, matches featuring a 10-percentage-point or greater gap in historical first-serve win rates produced an average of 23.8 games, whereas pairs with serve win rates within 3 points of each other averaged 26.1 games. Second-serve percentages showed weaker correlation, yet when both players posted second-serve win rates above 52 percent the game count dropped by roughly 1.9 games on average.
Patterns Observed in 2025 Clay Swing
During the 2025 European clay season, several notable ranking tournaments provided fresh data points. In Madrid, three repeat matchups between players ranked inside the top 30 followed the established trend: the player with the superior prior serve-win differential won in straight sets totaling under 20 games in each case. Rome offered contrasting examples where both competitors entered with similar serve metrics, and those encounters extended to three sets more than 60 percent of the time, pushing game counts above 28.
Figures from the WTA performance data platform confirm that serve percentage gaps widen on clay when altitude and temperature vary, as seen in Madrid's high-elevation conditions versus sea-level venues like Rome. Those environmental factors alter bounce and speed, which in turn influences how effectively players land first serves and convert them into shorter points.
Influence of Ranking Level and Surface Adaptation
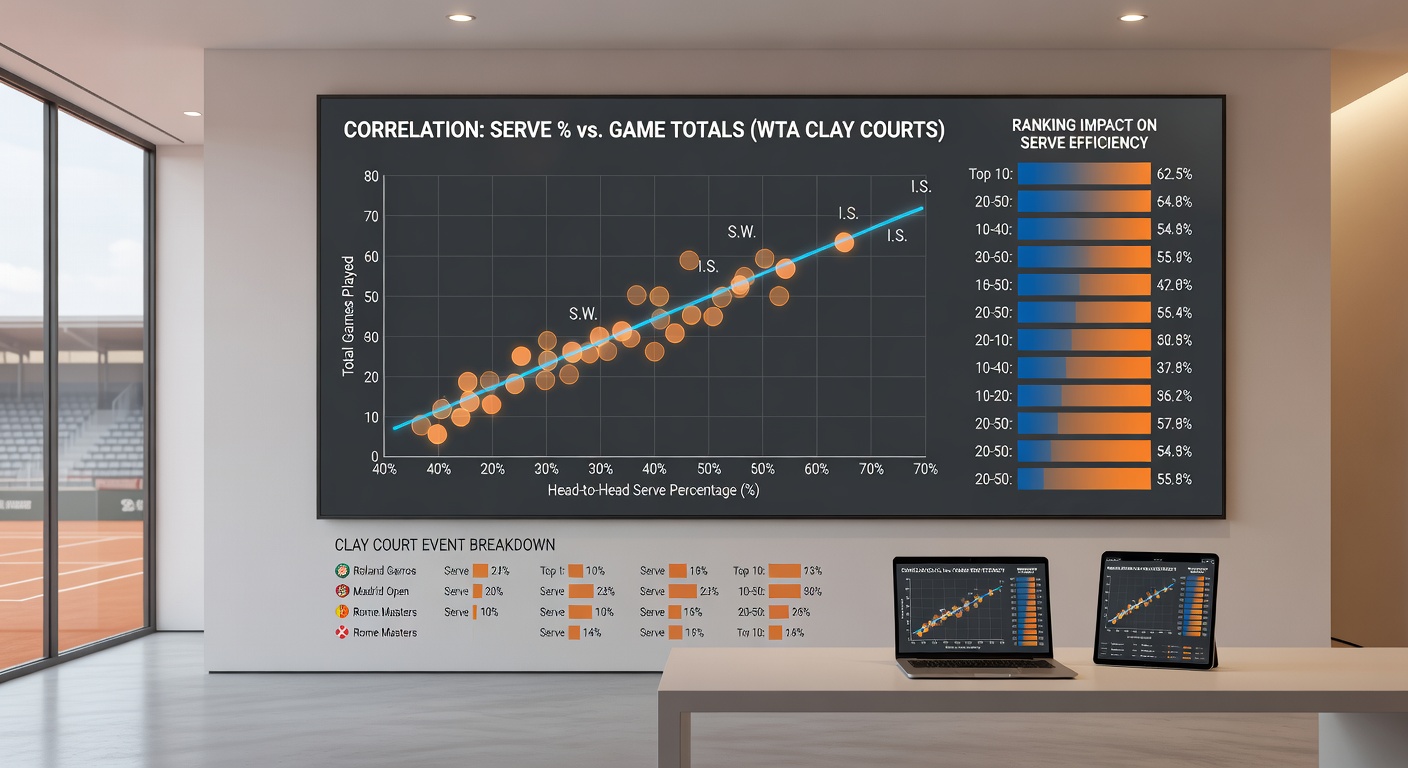
Players inside the WTA top 50 exhibit stronger correlations between historical serve data and game totals than lower-ranked competitors, according to breakdowns by ranking tier. Top-50 athletes maintain more stable serve percentages across surfaces, so their clay-court head-to-head records align closely with overall career numbers. Lower-ranked players show greater variance, partly because they adapt less consistently to the slower clay movement and higher bounce.
Studies from the International Tennis Federation technical reports highlight that clay-court rallies average 2.8 seconds longer than hard-court rallies at equivalent rankings, which magnifies the value of a reliable first serve in keeping game counts manageable. When serve percentages from prior clay meetings are layered onto current ranking points, the predictive range for total games narrows to within three games in roughly 70 percent of observed cases.
Considerations for Upcoming 2026 Events
As the 2026 clay season approaches in May, with Madrid and Rome scheduled once again, analysts continue to update head-to-head serve databases with the most recent matches. Early indications from warm-up events in April suggest several top-20 pairings carry serve differentials that historically correlate with shorter game totals. Tournament organizers and media outlets reference these metrics when previewing potential draw paths, though actual outcomes depend on daily conditions and individual form.
Additional variables such as recent injury recoveries and schedule density affect how closely past serve percentages predict current match lengths. Data sets that incorporate only ranking tournaments exclude exhibition and non-ranking events to maintain consistency in competitive intensity and surface preparation standards.
Conclusion
Correlations between head-to-head serve percentages and game totals on WTA clay ranking events rest on aggregated match data that spans multiple seasons and venues. The relationships appear most consistent among higher-ranked players and in events where surface conditions remain stable. As new results from 2026 tournaments enter the records, these patterns will undergo further testing against fresh head-to-head samples.