3 Jul 2026
Navigating Value in Formula One Safety Car Deployment Markets Across Grand Prix Seasons
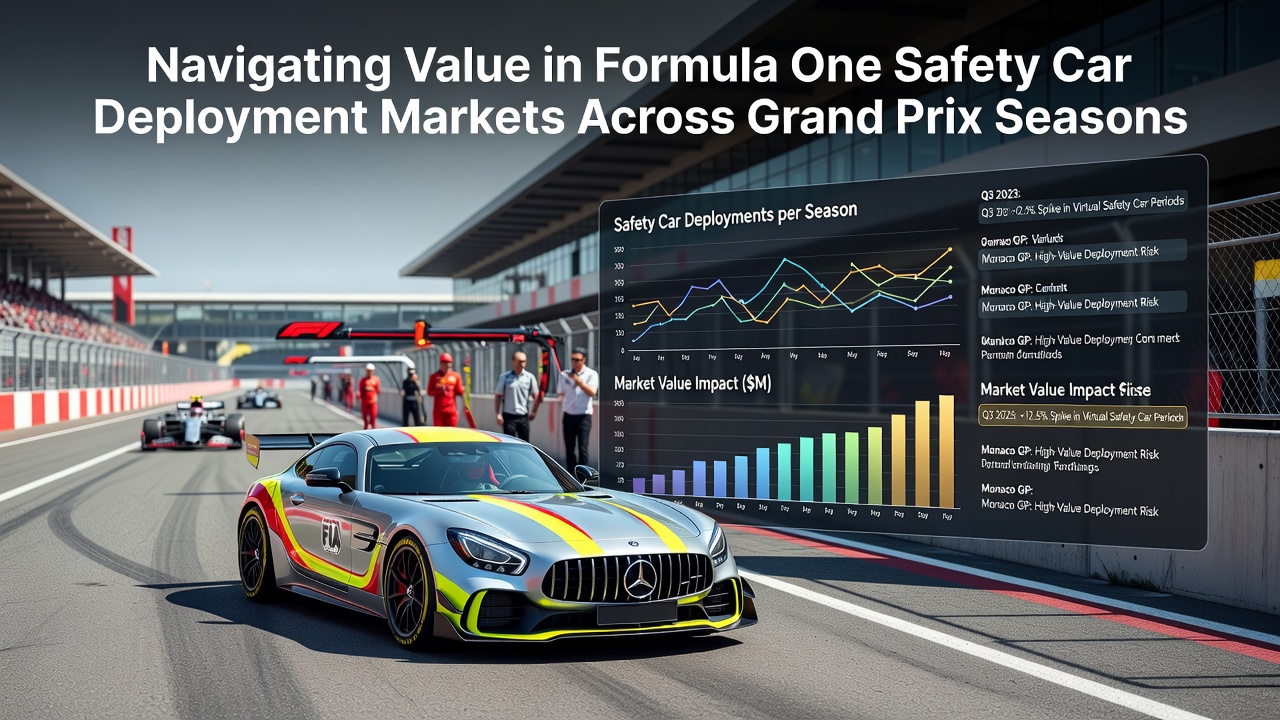
Formula One safety car deployments occur when race officials determine that track conditions pose immediate hazards to competitors, and these interventions create distinct patterns that analysts examine across multiple seasons. Data compiled by the FIA shows that safety cars enter the track an average of 1.8 times per race in recent years, with higher frequencies at street circuits such as Monaco and Singapore where barriers sit closer to the racing line. Observers note that wet weather sessions increase deployment rates by roughly 40 percent compared with dry conditions, while mechanical failures and multi-car collisions account for the remaining share of interruptions.
Historical Deployment Patterns and Circuit Characteristics
Circuits with narrow run-off areas and high-speed corners tend to trigger more frequent safety car periods because even minor incidents require rapid response to protect both drivers and marshals. Research from the motorsport safety division at Monash University indicates that venues like the Hungaroring and Circuit de Spa-Francorchamps record above-average intervention counts during the summer months when ambient temperatures rise and tire degradation accelerates. Seasonal shifts also appear when teams introduce aerodynamic updates mid-year, altering car behavior and occasionally raising the likelihood of spins in high-downforce configurations.
Market Dynamics in Safety Car Betting Lines
Betting markets on safety car appearances price probabilities for first-lap interventions, total deployments per race, and timing windows such as before lap 10 or after lap 40. Lines adjust rapidly once practice sessions reveal weather forecasts and when teams report reliability concerns with power units or suspension components. Figures released by the Australian Grand Prix Corporation reveal that Melbourne events have seen safety cars appear in 7 of the last 10 editions, often due to opening-lap chaos on the tight first sector, and these statistics feed directly into opening odds offered by licensed operators.
Seasonal Variations and Regulatory Influences
Each new technical regulation cycle alters the balance between outright speed and mechanical durability, which in turn affects how often incidents escalate to full safety car periods. The 2022 ground-effect rules initially produced more porpoising-related retirements before teams refined floor designs, and deployment counts settled closer to historical norms by the 2024 season. Analysts tracking 2025 data already observe tighter fields and fewer single-car spins, yet multi-car collisions at the start remain a consistent trigger across both sprint and grand prix formats.

July 2026 brings the first races under the revised power-unit regulations that emphasize sustainable fuels and larger battery deployment, and early simulations suggest these changes could influence reliability during the opening phase of the season. Pre-season testing at Bahrain in February 2026 will provide the initial dataset that market makers use to calibrate lines for the Canadian and Austrian rounds later that summer. Those who follow deployment markets closely monitor not only weather models but also telemetry leaks regarding new energy-recovery systems that might overheat under race conditions.
Factors That Shift Market Value Mid-Season
Real-time information such as red-flag frequency during free practice, updates on track-surface repairs, and even changes in marshal deployment protocols can move odds within hours. Data aggregated across the 2023 through 2025 campaigns shows that circuits hosting night races experience a modest uptick in late-race safety car calls, largely because cooler track temperatures coincide with higher tire-wear rates after sunset. Teams that struggle with brake cooling or floor-edge sealing often contribute to the statistical tail that pushes total deployment counts above market expectations.
Regulatory bodies continue to refine virtual safety car thresholds and double-yellow procedures, and these adjustments occasionally compress the window in which a physical safety car becomes necessary. The FIA technical department publishes annual reports that detail the precise criteria applied at each event, allowing quantitative models to incorporate rule changes when projecting future probabilities.
Conclusion
Markets built around Formula One safety car deployments reward systematic review of circuit profiles, seasonal regulatory shifts, and live telemetry trends rather than isolated race narratives. Patterns established over multiple years provide a foundation for evaluating value, while emerging data from the 2026 power-unit era will test whether historical baselines remain reliable or require recalibration. Observers who integrate FIA statistics with venue-specific records continue to refine approaches that account for both predictable environmental factors and the occasional regulatory surprise that alters deployment frequency across an entire season.